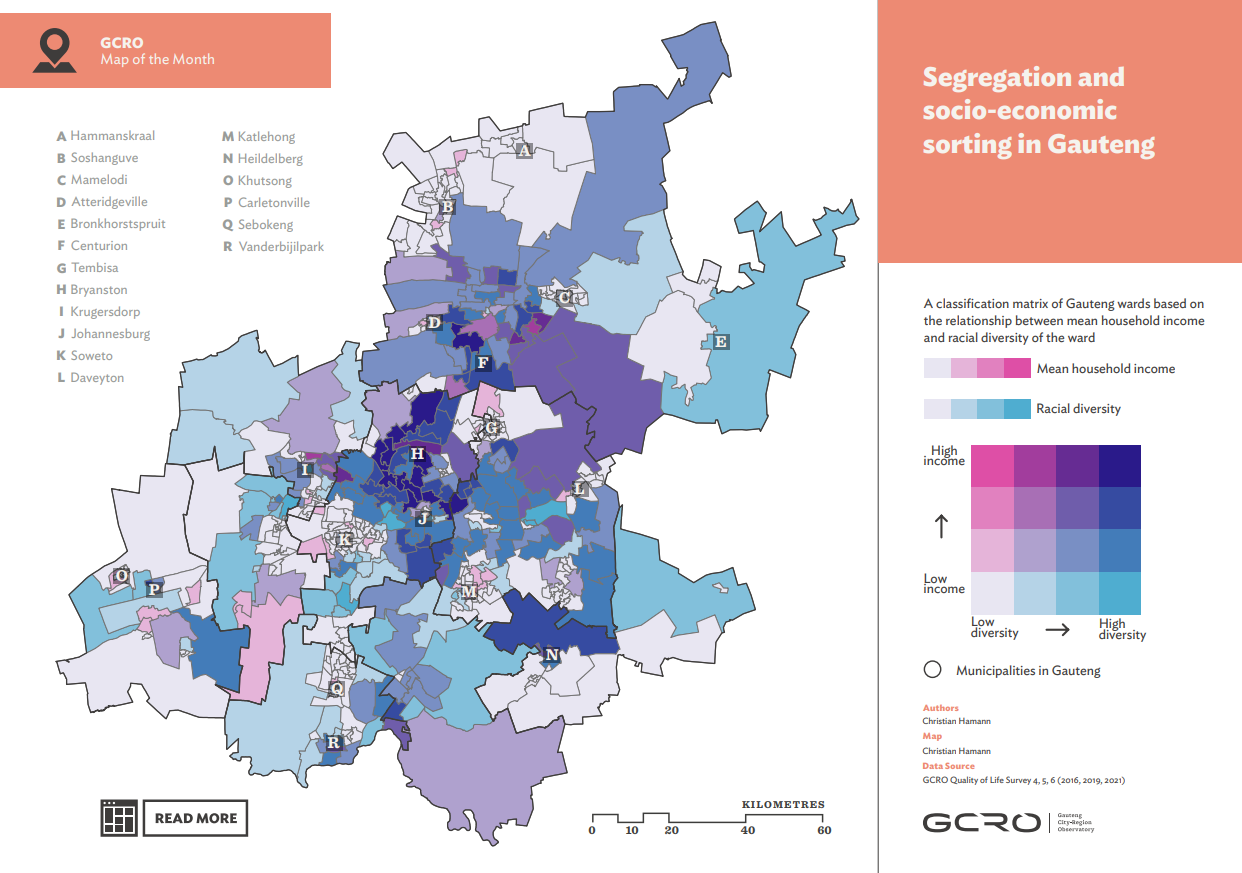
Segregation and socio-economic sorting in Gauteng

Segregation research on South African cities highlights the achievements and limits of spatial transformation. While inner cities and former whites-only suburbs have seen significant changes, townships remain racially homogenous. Racial integration tends to increase with the income level of a residential area, with desegregation in affluent suburbs driven by income rather than race. This map of the month report employs a bivariate mapping technique to analyse racial diversity and income levels in Gauteng's wards. It shows areas with both high diversity and income and areas with low diversity and income, along with interesting spatial variations between these extremes.
The map uses data from the GCRO QoL surveys, combining demographic and household income data, and employs the Entropy Index to calculate racial diversity. Household incomes were adjusted for inflation to 2017 prices, and ArcGIS Pro was used to combine racial diversity and income data, classifying wards based on these variables.
Abstract based directly on original source.


Comments